Have you ever wondered what it would be like to see the music? An audio visualizer makes that possible, turning sound into mesmerizing visuals that move with your favorite tunes. But how do audio visualizers work? They analyze sound frequencies and rhythms, creating real-time visual displays that sync perfectly with the music. From simple waveforms to abstract patterns, an audio visualizer tool brings sound to life in a whole new way.
So, what is an audio visualizer? It’s a tool that transforms music into captivating visuals, enhancing the listening experience by making sound more interactive and visually engaging. Whether for live performances, music videos, or personal enjoyment, these tools make music come alive on screen. Platforms like doodooc allow users to create stunning real-time visualizations, ideal for music producers, artists, or anyone who wants to enjoy their music in a more dynamic way.
Understanding Sound Waves and Frequency: The Science Behind Audio Visualization
To see how audio visualizers work, it helps to first get to know the basics of sound. Sound waves are vibrations that move through the air or other materials, and they have two main parts: frequency and amplitude. Frequency tells us how fast these waves are moving, which affects the pitch we hear. High frequencies produce sharp, high-pitched sounds, while low frequencies result in deep, bass-like sounds. Amplitude relates to the volume or loudness of the sound—the bigger the amplitude, the louder the sound.
When it comes to sound waves visualization, these two factors—frequency and amplitude—determine what we see on the screen. High-pitched sounds might be represented by quick, detailed shapes or thin lines, while lower sounds could show up as slower, larger movements or pulsing visuals. If you’ve ever watched a music visualizer, you’ve probably noticed the way different parts of the song create varying shapes and movements. That’s the visual representation of these sound properties.

The process of turning sound into visuals involves digital sound processing. This technology converts the sound into digital data, which an audio visualizer interprets and translates into real-time imagery. This is where audio data visualization comes in, creating visual effects that match the rhythm, beats, and energy of the music. These visualizations not only make the music more engaging but also let viewers “see” the sound, revealing details in the music that might otherwise be missed.
How Audio Visualizers Process Sound: Techniques and Technologies Explained
So, how do audio visualizers work to convert sound into visuals? It all starts with audio visualizer processing, where the software analyzes the incoming audio signal and translates it into visual data. One key method used in this process is the Fast Fourier Transform (FFT), a mathematical technique that breaks down complex sound waves into their individual frequencies.
Key Point: FFT in audio visualizers is crucial because it allows the software to display a frequency breakdown of the sound, creating the foundation for all the visuals you see.
Tip: The clearer the frequency breakdown, the more precise and engaging the visuals will be.
By using frequency analysis in audio visualizers, the software identifies which frequencies are present at any given moment and turns them into real-time visuals. This technique forms the backbone of digital audio processing for visualizers, enabling the representation of a song’s lows, mids, and highs as unique visuals.
Key Point: The FFT breaks down complex sound input into manageable frequency components, which are then visually represented as bars, lines, or abstract forms.
Tip: Lower frequencies like bass may be shown as slow, heavy pulsing shapes, while higher frequencies like vocals often appear as sharp, fast-moving lines or spikes. This dynamic shift in visuals makes the experience more immersive.
For example, in a typical waveform audio visualizer:
- Low frequencies (bass) = Slow, heavy pulsing shapes or bars
- High frequencies (treble, vocals) = Sharp, fast-moving lines or spikes
- Key Point: These real-time, synchronized visuals deepen the connection between what’s heard and what’s seen, making the audio experience more dynamic and engaging.
In more advanced visualizers, like doodooc which is also used in live performances or music videos, the visuals can go beyond simple frequency breakdowns. Abstract audio visualizers use color shifts, 3D shapes, and intricate patterns to represent music in artistic and unexpected ways.
Key Point: Advanced visualizers interpret music genres differently, with vibrant displays for electronic music or smooth, flowing designs for ambient tracks.
Tip: Some platforms allow customization, enabling users to interact with and enhance the visuals based on their preferences.
Overall, audio visualizer processing bridges the gap between sound and sight, transforming music into a living, moving work of art. The use of FFT in audio visualizers, combined with frequency analysis in audio visualizers, makes it possible to create visually engaging representations of sound in real-time.
Types of Audio Visualizations: Waveforms, Spectrums, and More
There are several types of visualizations that audio visualizer tools use to represent sound. Each type serves a different purpose, catering to various creative or technical needs.
- Waveforms: Amplitude over time.
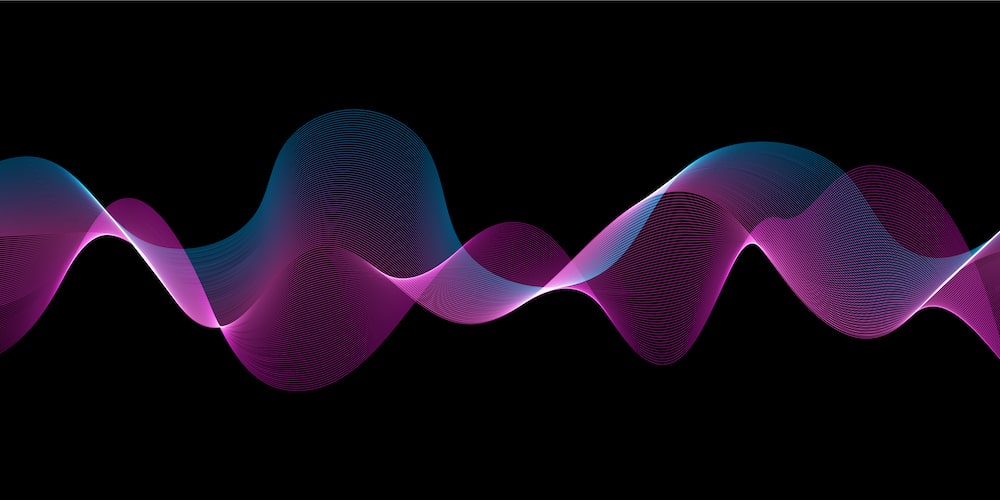
Waveforms are one of the most common types of visualizations, representing the amplitude of the sound over time. In a waveform audio visualizer, the vertical axis represents the sound’s loudness (amplitude), while the horizontal axis represents time. As the music plays, the waveform moves, providing a real-time visual representation of the sound’s volume changes. - Use case: Waveforms are frequently used in audio editing software (like Audacity or Adobe Audition) to help professionals edit sound precisely by visually identifying sections that need adjustments. They’re also popular in music visualizers for DJs to track beats during live performances.

- Audio Spectrums: Frequency breakdown.
An audio spectrum visualizer breaks the sound into its frequency components, displaying how much of each frequency is present at any given moment. The spectrum is divided into bars or lines, where each section represents a specific frequency range (from bass to treble). This type of visualization is particularly useful for showing the distribution of low, mid, and high frequencies, offering a deeper insight into the structure of the audio.
- Use case: Audio spectrums are commonly used by sound engineers and producers to balance sound frequencies during mixing and mastering. They’re also found in media players (like VLC or Winamp) to provide a more technical breakdown of the music for users who want to see the frequency distribution of their tracks.

- Abstract and 3D Visualizations: More artistic visual interpretations.
For more artistic and immersive experiences, 3D music visualizers and abstract visualizations take the sound representation to another level. These visualizers often use a combination of waveforms and spectrums but add depth and motion to create more dynamic and visually engaging outputs. The visuals can be geometric patterns, fluid shapes, or completely abstract forms that respond to the music’s rhythm and frequency, creating a mesmerizing display.
- Use case: Abstract and 3D visualizers are often used in music videos, live performances, and virtual events to create visually captivating experiences. Artists and performers use them to enhance the visual appeal of their shows, while VJs (visual jockeys) use them to sync visuals with live music during concerts or festivals.

Real-Time Audio Visualization: Enhancing Live Music Experiences
Real-time audio visualizers add an exciting element to live performances by syncing visuals with live music. Unlike pre-recorded tracks, a live music visualizer processes sound in real time, instantly responding to the music’s energy and beat. Thanks to real-time sound visualizer technology, these visuals stay perfectly in sync with the audio, creating a dynamic and interactive experience.
These visualizers elevate the show by turning music into a multisensory experience. Imagine a DJ set where pulsating lights and dynamic patterns transform the stage into a visual spectacle. Music isn’t just heard—it’s seen and felt.
- Bass Drops: Explosive colors and sharp shapes match the high energy of bass-heavy moments.
- Quieter Sections: Softer, flowing visuals move in sync with the music, creating a soothing, immersive vibe.
And why did the audio visualizer break up with the metronome? Because it couldn’t handle the constant beat!
Artists and DJs use live audio processing to engage audiences like never before. At electronic music festivals, huge LED screens display synchronized visuals that make the crowd feel part of the show. Visuals respond to the rhythm, volume, and frequency, turning sound into an art form.
In short, real-time audio visualizers turn live performances into unforgettable, immersive experiences.
Top Audio Visualizer Tools and Software: Best Options for Creators
For creators looking to integrate visuals into their music or audio projects, several audio visualizer tools are available, each offering unique features to suit different needs.
Adobe After Effects
Adobe After Effects is a powerful tool that allows creators to design custom audio visualizers. With advanced features and plugins, users can create highly detailed and dynamic visualizations for music videos and digital content. It’s ideal for professionals who want complete control over the design and output.

VLC Media Player
VLC is not just a media player; it also includes a built-in audio visualizer tool. While not as feature-rich as other software, it’s a great free option for those who want to add basic visualizations to their music playback.

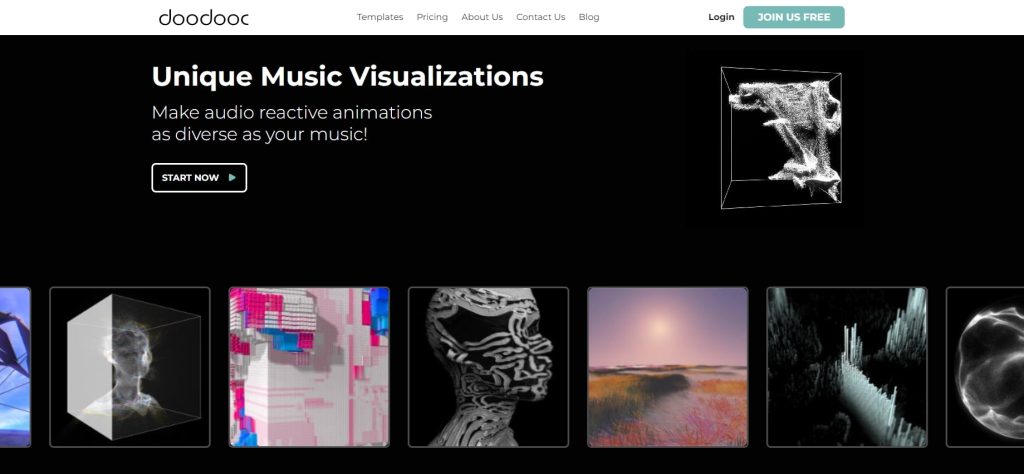
doodooc: The Modern AI Music Visualizer Revolutionizing Audio Experiences
Among the best audio visualizers, doodooc stands out for the depth of music analysis and AI-driven approach to audio visualization. This cutting-edge platform enhances music experiences by transforming sound into stunning visuals, offering high-quality, cost-effective solutions for both professional creators and casual users.

- Advanced AI Analysis: doodooc utilizes a sophisticated 11-layer system to analyze audio, producing real-time visualizations that synchronize flawlessly with the music. Each visual movement is meticulously timed to reflect the rhythms and melodies, resulting in an immersive audio-visual experience.
- User-Friendly Design: With an intuitive interface, users can easily upload their music at doodooc.com and generate impressive visuals within minutes. Featuring over 400 customizable templates, it allows even those without technical expertise to create captivating video content effortlessly.
- Customization Options: For artists seeking more personalized visuals, doodooc offers a special package where users can request customizations such as text, images, or logos. The dedicated team works closely with creators to bring their vision to life, ensuring every element reflects their unique style.
- Flexible Output Resolutions: doodooc provides visuals without resolution limits, making it suitable for everything from standard social media content to large-scale live performances. Its real-time visualizations react dynamically to every beat, enhancing the overall performance experience.
Whether you’re a music producer, DJ, or someone looking to elevate your content, doodooc offers a powerful tool to take your creativity to the next level. Sign up now on doodooc.com and let doodooc help you create your unique, audio-reactive music visualizers today!
The Importance of Audio Visualizers
Audio visualizers have revolutionized the way we experience music, transforming sound into stunning visuals that captivate both the eyes and ears. From understanding the science of sound waves to exploring the role of digital sound processing and real-time visualizers, these tools bring a whole new dimension to the audio experience. Whether you’re creating music videos, enhancing live performances, or simply enjoying your favorite tracks, audio visualizers allow you to see sound in a creative and dynamic way.
For those looking to take their music to the next level, platforms like doodooc offer the perfect solution. With its powerful AI-driven technology, doodooc enables you to create unique, high-quality audio reactive visualizers that sync seamlessly with your music. Whether you’re a music producer, content creator, or casual listener, doodooc makes it easy to generate stunning visuals in just a few clicks.
Ready to make your music truly stand out? Follow doodooc and sign up to start creating your own personalized audio visualizers today. Unlock a new realm of creativity and let your music shine like never before!

